
Introduction to stress strain curve
Stress Strain diagram is an important graphical measure of material’s mechanical properties. It can be obtained from tensile testing of material in the Universal Testing Machine following standards below, e.g. ASTM E8 or IS 1608 for metals, ASTM D638 for plastics and ASTM D3039 for composites.
Stress is internal resistance of material offered against deformation which is force per unit area. Stress induced in material depends upon the nature of force, point of application and cross-sectional area of material. it can be tensile, compressive and shear. it is represented by σ. Stress is induced only when motion of body is restricted either by some force or reaction induced.
On basis of cross-sectional area, direct stress can be of two types,
- Engineering Stress(σe) or Nominal Stress where Ao=original c/s area of specimen
- True Stress(σt) or Actual Stress where Aa=Actual instantaneous c/s area of specimen at that particular time of loading
Strain is the deformation per unit length caused by normal force in that direction, it is a dimensionless quantity. It is represented by ε.
On basis of length of member, direct strain can be of two types,
- Engineering Strain(εe) where lo=original length of member
- True Strain where la=actual instantaneous length at the time of loading
Stress-Strain Curve
The stress-strain curve is a representation of the performance of the specimen as the applied load is increased monotonically usually to fracture. Stress-strain curves are usually presented as:
- “Engineering” stress-strain curves, in which the original dimensions of the specimens are used in most calculations.
- ‘True” stress-strain curves, where the instantaneous dimensions of the specimen at each point during the test are used in the calculations.
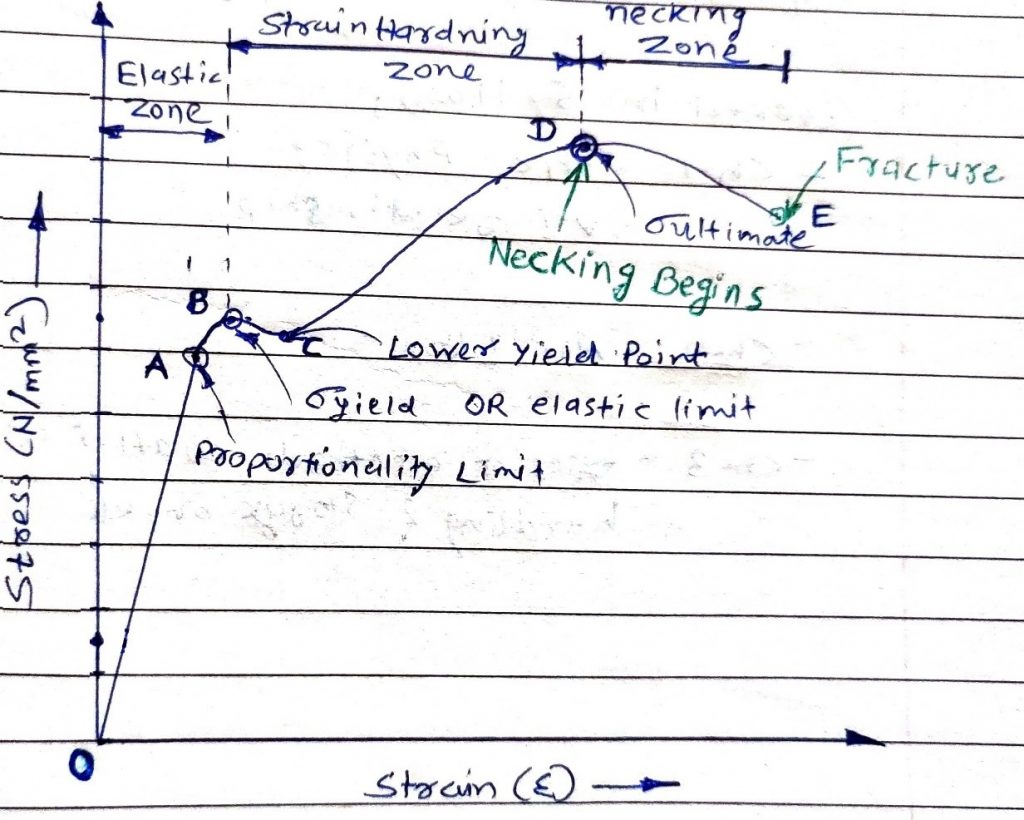
0-A: Proportionality Limit– initial straight-line portion is the elastic region, where stress is linearly proportional to strain. The point at which the curve departs from the straight-line proportionality, A, is the proportional limit. Hook’s law is valid upto this point. Modulus of elasticity can be calculated from the slope of line.
E = σ / ϵ
Modulus of elasticity is a measure of the stiffness of the material. The greater the modulus, the steeper the slope and the smaller the elastic strain resulting from the application of a given stress.
A-B: Elastic Limit– Non-linear portion beyond proportionality limit in which still material behaves elastically. The elastic limit is the maximum stress that can be applied without permanent deformation to the specimen. End of elastic region is at yield point. Some materials have definite yield point while some don’t.
The yield strength, shown at point σy in Fig. 1, is the stress required to produce a small specified amount of plastic deformation. Here material behaves plastically and won’t regain its shape back. Yield point phenomena is usually different for different metals.
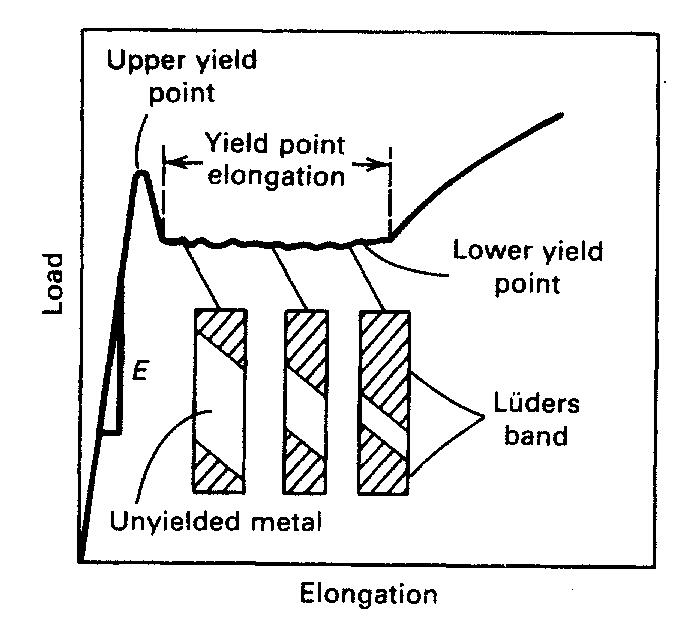
Fig.2 Discontinuous yielding with yield stage between upper yield point and lower yield point. Typical behavior of Low Carbon Steel
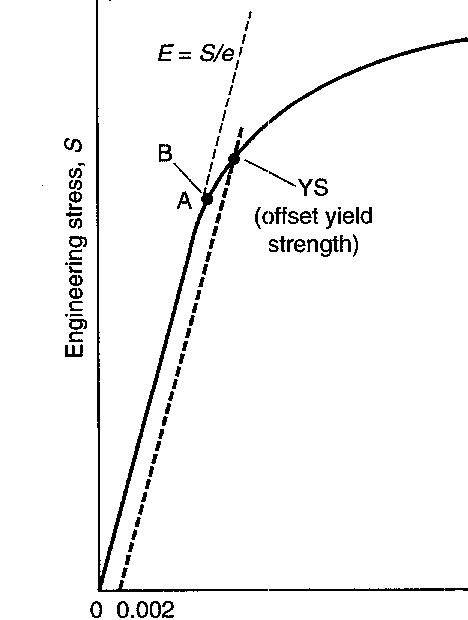
Fig.3 Continuous yielding condition where offset yield point is taken e=0.002 or 0.2% Strain Typical behavior of ductile metals like Al, Cu
B-D: Strain Hardening- The stress required to produce continued plastic deformation increases with increasing plastic strain, that is, the metal strain hardens. The volume of the specimen (area x length) remains constant during plastic deformation, and as the specimen elongates, its cross-sectional area decreases uniformly along the gauge length. Initially, the strain hardening more than compensates for this decrease in area, and the engineering stress continues to rise with increasing strain. but a point is reached where the decrease in specimen cross-sectional area is greater than the increase in deformation load arising from strain hardening. This condition will be reached first at local point in the specimen that is slightly weaker than the rest. All further plastic deformation is concentrated in this region, and the specimen begins to neck or thin down locally. Maximum is observed in the curve at the point D in Fig.1 also called UTS.
D-E: Necking Zone- Until the neck forms, the deformation is essentially uniform throughout the specimen, but after necking all subsequent deformation takes place in the neck. In the crystal lattice of the metal bar so many dislocations have occurred that they can no longer lead to hardening but instead contribute to the formation of voids or cavities. The neck becomes smaller and smaller, and stress required decreases for further plastic strain. Finally, metal ruptures at point E in Fig.1 is also known as Fracture Stress.
Information obtainable from Stress Strain Curve / What information do we get from Stress Strain Curve ?
Tensile strength: Stress corresponding to the maximum force. It is also called UTS. (D in Fig.1)
Yield strength: Stress at a point is reached during the test at which plastic deformation starts occurring. (B in Fig.1)
Ductility: It can be measured in two ways
% elongation: Increase in the gauge length of the test piece at maximum force, expressed as a percentage of the original gauge length. Because an appreciable fraction of the plastic deformation will be concentrated in the necked region of the tension specimen, the value will depend on the gauge length over which the measurement was taken (see the section of this article on ductility measurement in tension testing). The smaller the gauge length, the greater the contribution to the overall elongation from the necked region. Therefore, when reporting values of percentage elongation, the gauge length, L, should always be given.

% reduction in area: Maximum change in cross-sectional area that has occurred at the neck during the test expressed as a percentage of the original cross-sectional area.

Modulus of elasticity: It is the slope of initial linear portion of stress strain curve.
E = σ / ϵ
Resilience: it is the ability of a material to absorb energy when deformed elastically and to return it when unloaded. This property usually is measured by the modulus of resilience, which is the strain energy per unit volume, required to stress the material from zero stress to the yield stress, it is area under the curve upto yield point. For various grades of steel, the modulus of resilience ranges from 100 to 4500 kJ/m3. Triangular area of curve in Fig.4 shows modulus of resilience.
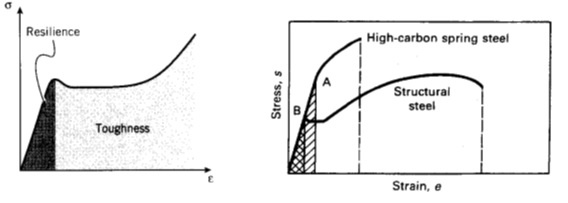
Toughness: The toughness of a material is its ability to absorb energy up to the point of fracture or rupture. Toughness may be considered to be the total area under the stress-strain curve to the point of fracture. This area, which is referred to as the modulus of toughness, is the amount of work per unit volume that can be done on the material without causing it to rupture.
In Fig.4, The high-carbon spring steel has a higher yield strength and tensile strength than the medium-carbon structural steel. However, the structural steel is more ductile and has a greater total elongation. The total area under the stress-strain curve is greater for the structural steel; therefore, it is a tougher material. This tells that toughness is a parameter that comprises both strength and ductility.
True stress-strain Curve
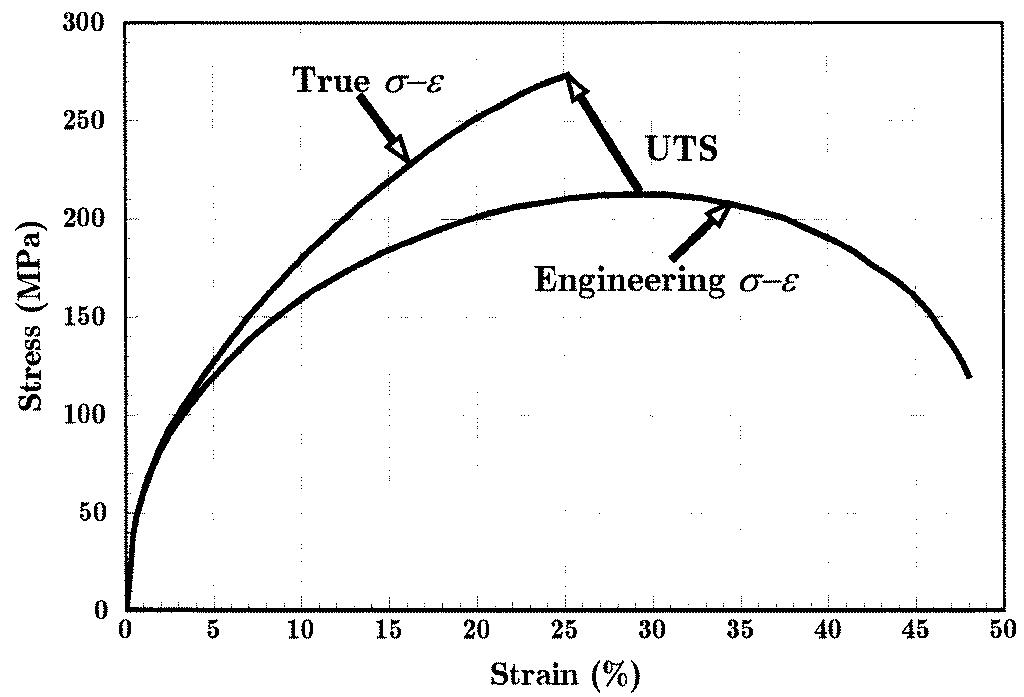
The engineering stress-strain curve does not give a true indication of the deformation characteristics of a metal, because it is based entirely on the original dimensions of the specimen and these dimensions change continuously during the test. Actually, the metal continues to strain harden to fracture, so that the stress required to produce further deformation should also increase. If the true stress, based on the actual c/s area of the specimen, is used, the stress-strain curve increases continuously to fracture. If the strain measurement is also based on instantaneous measurement, the curve that is obtained is known as true-stress true-strain curve.
Factors affecting stress strain curve
- Composition
- Heat treatment and conditioning (annealed, cold rolled, normalized, quench & tempered etc.)
- Prior history of plastic deformation
- The strain rate of test (rate of loading)
- Temperature
- Orientation of applied stress relative to the test specimens’ structure (longitudinal or transverse)
- Size and shape of specimen (bar, sheet, strip)
Simplified interpretation from Stress Strain curve

Stress Strain Curve for Various Metals and Conditions

Fig.7 Stress Strain Curves for different Carbon steels
WI- Wrought Iron
MS- Mild Steel
MCS- Medium Carbon Steel
HCS- High Carbon Steel
HSS- High Speed Steel
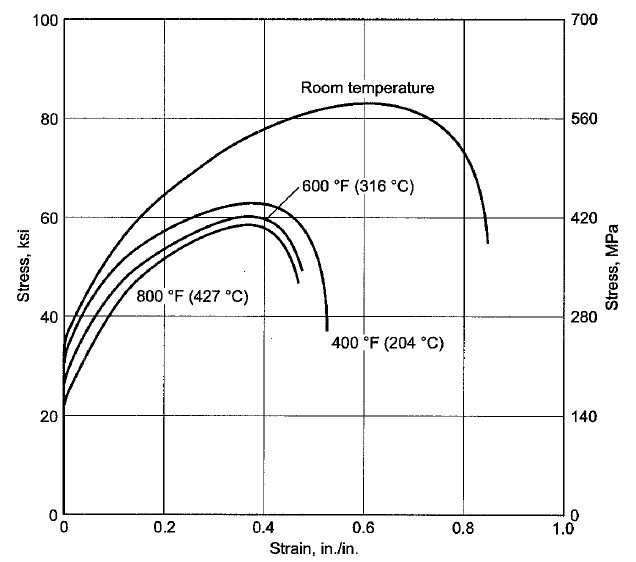
Fig.8 Stress Strain curve of 304 stainless steel, general specimen, at room and elevated temperatures
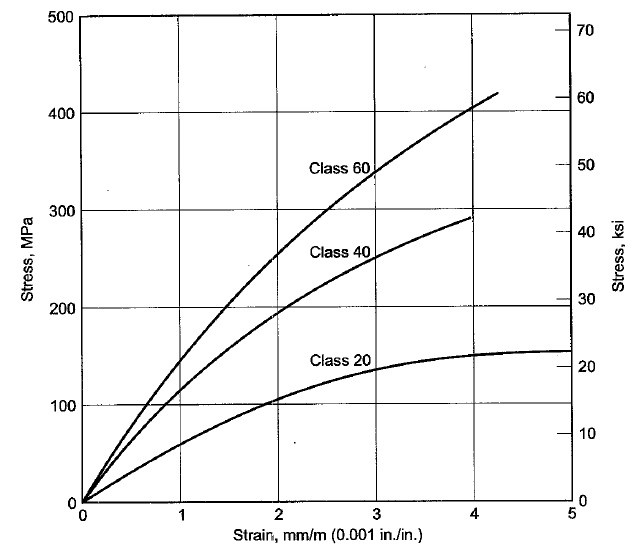
Fig.9 Stress Strain curve of Grey Cast Iron Class 20,40,60
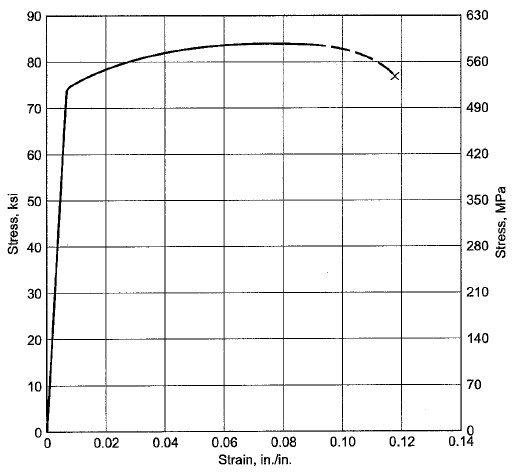
Fig.10 Stress Strain curve of 7075-T6 Aluminum-Zinc Alloy, Cold Rolled, Room Temp, Longitudinal Direction, used in aerospace industry
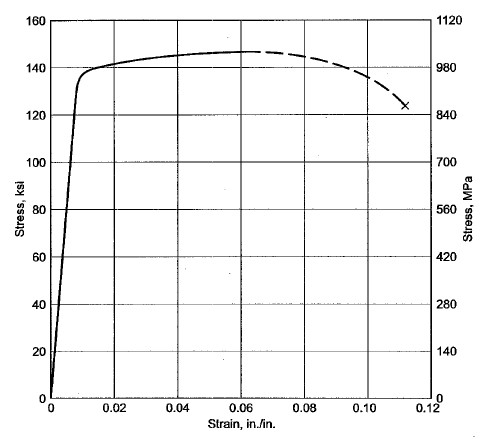
Fig.11 Stress Strain curve of Titanium alloy Ti-6Al-4V (alfa-beta titanium ASTM Grade 5), annealed sheet at RT, widely used in aerospace industry
References
- “Atlas of Stress-Strain Curves”, 2nd ed., ASM International, 2002
- A. Ghosh and A.K. Mallik, “Manufacturing Science”, East-West Press Pvt. Ltd., 2010
- David Roylance, Lec. on “Stress-Strain Curves”, Massachusetts Institute of Technology, 2001
- “Strength of Materials”, GATE ME, Made-Easy Education Pvt. Ltd., 2018